vunet built vusmartmaps (vsm) — an observability platform that financial institutions use to identify, diagnose, and resolve errors across their distributed components. in 2025, i was hired as a design-consultant, to work on ambiguous asks.
a fourth of what the product enabled people to do was create, consume & act on alerts. i worked for 3 months, to synthesise product & engineering work done over the last 3 years, and proposed a better system for alert-consumption & an industry-first approach to alert-creation.
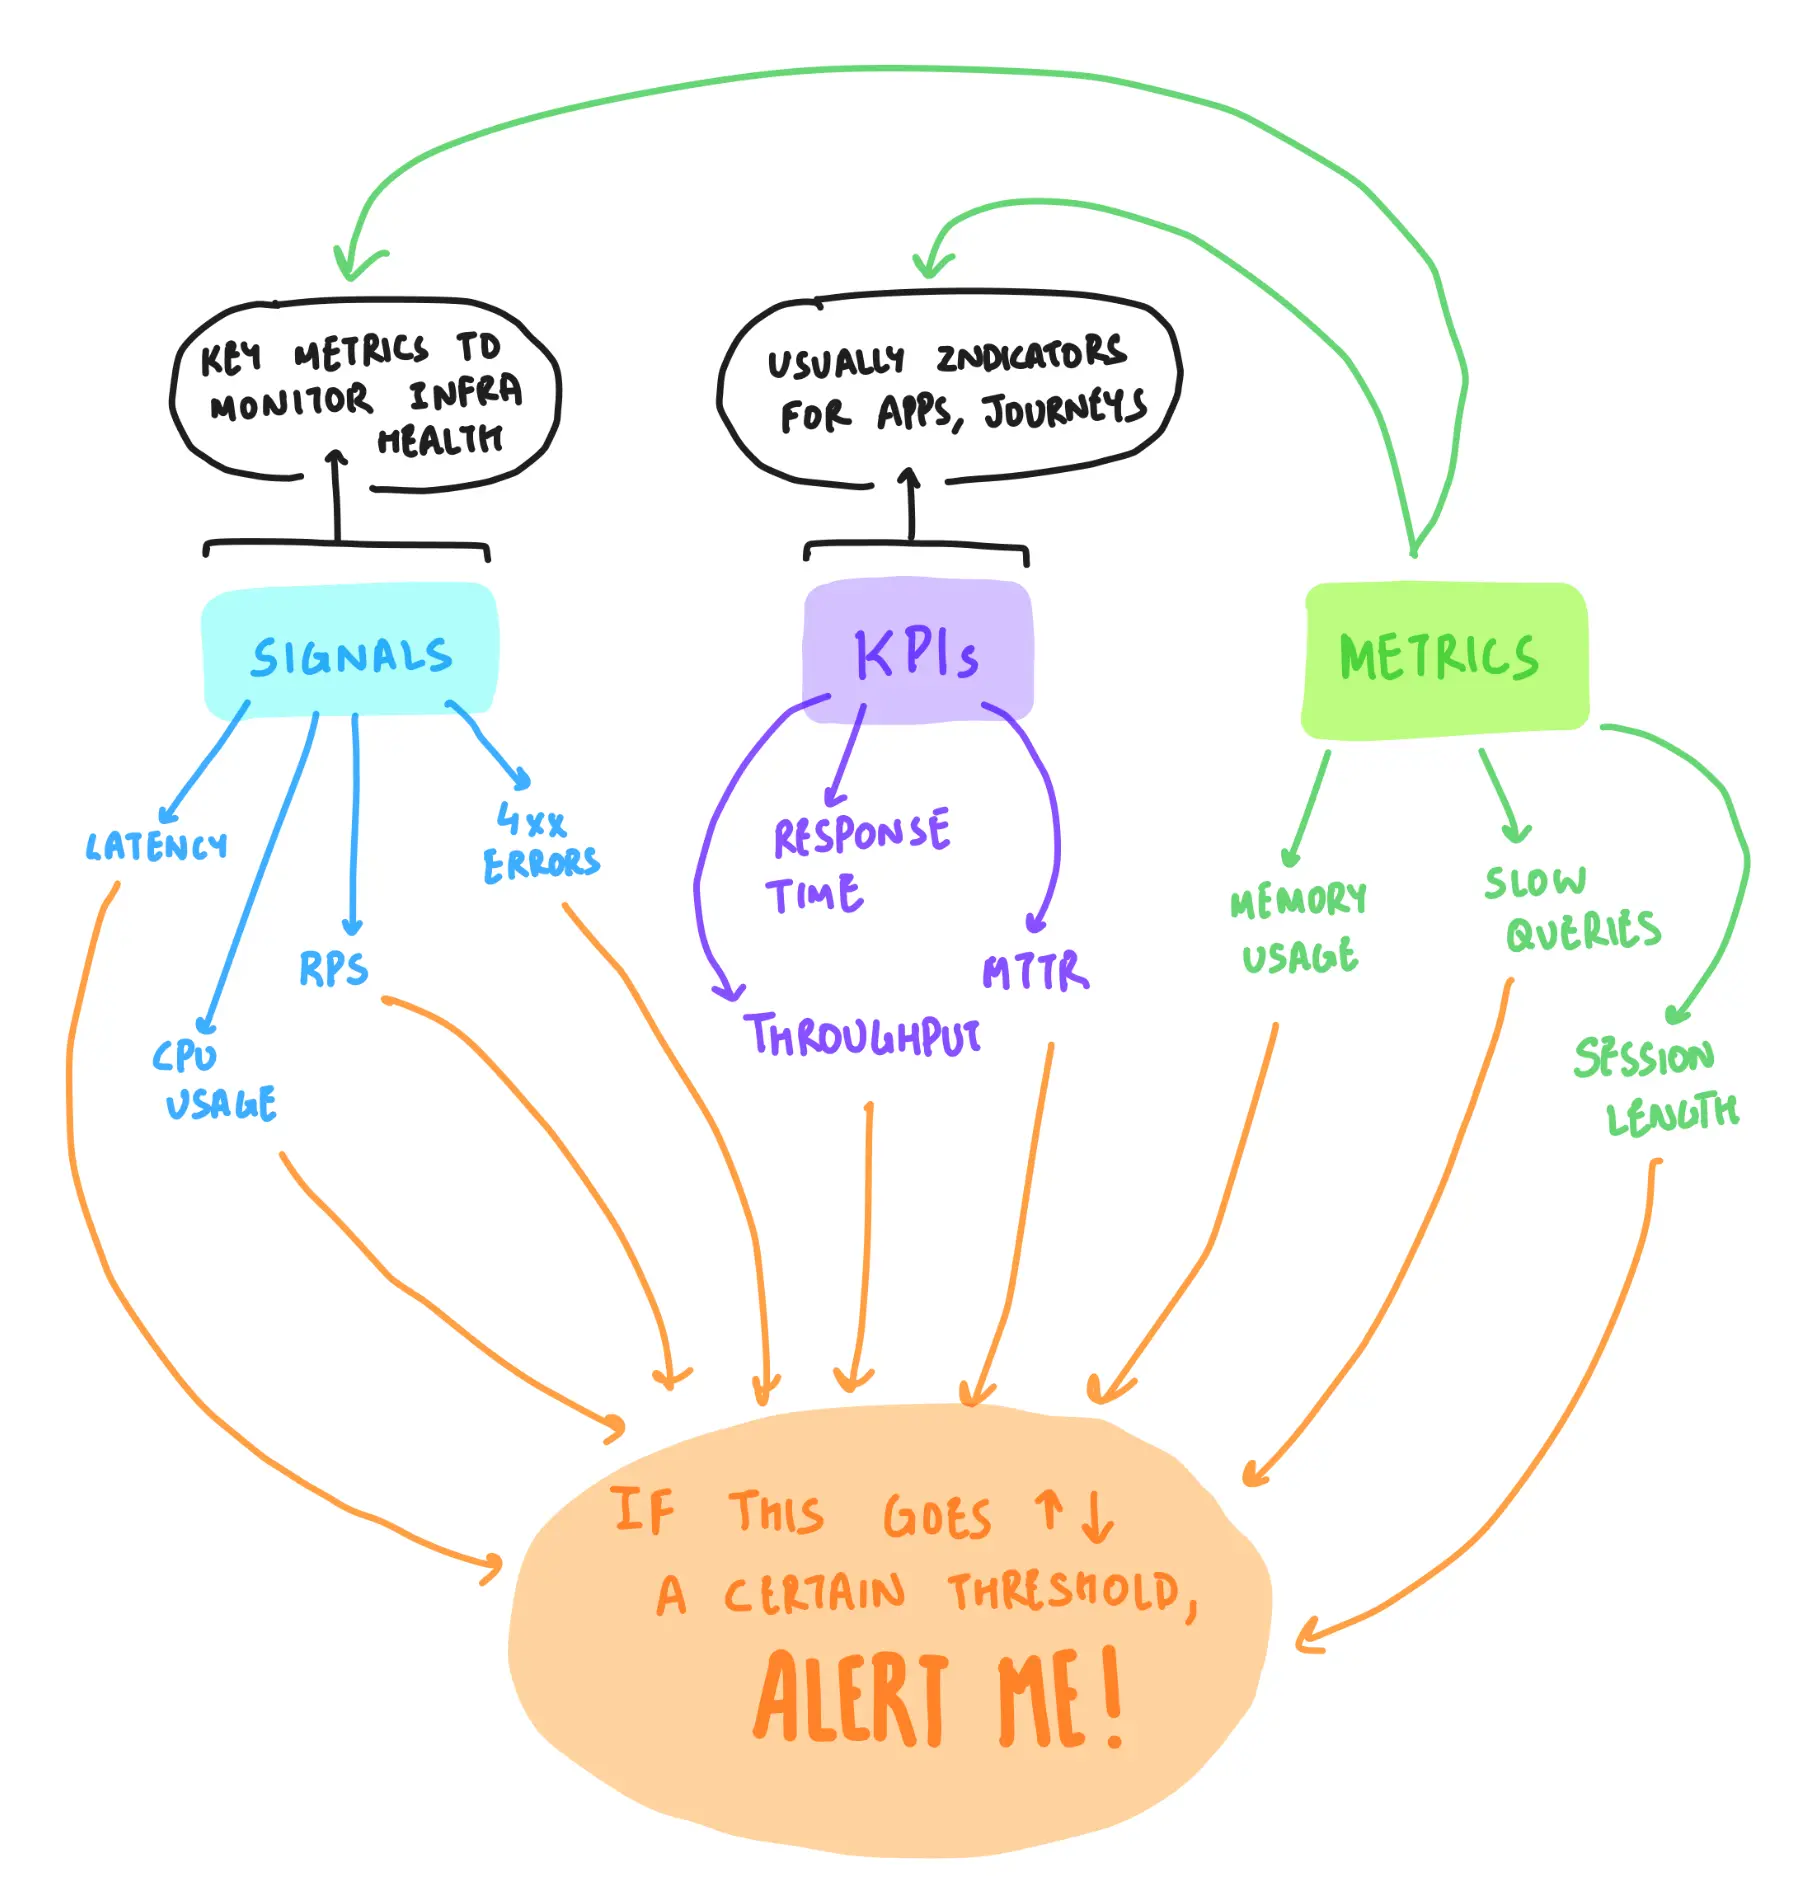
vsm monitored things — individual computing components (such as routers, servers, load-balancers, et-cetera), applications that run on those components (such as a bank's log-in page, core-banking-system, et-cetera), and custom-defined business-journeys (comprising many components & applications).
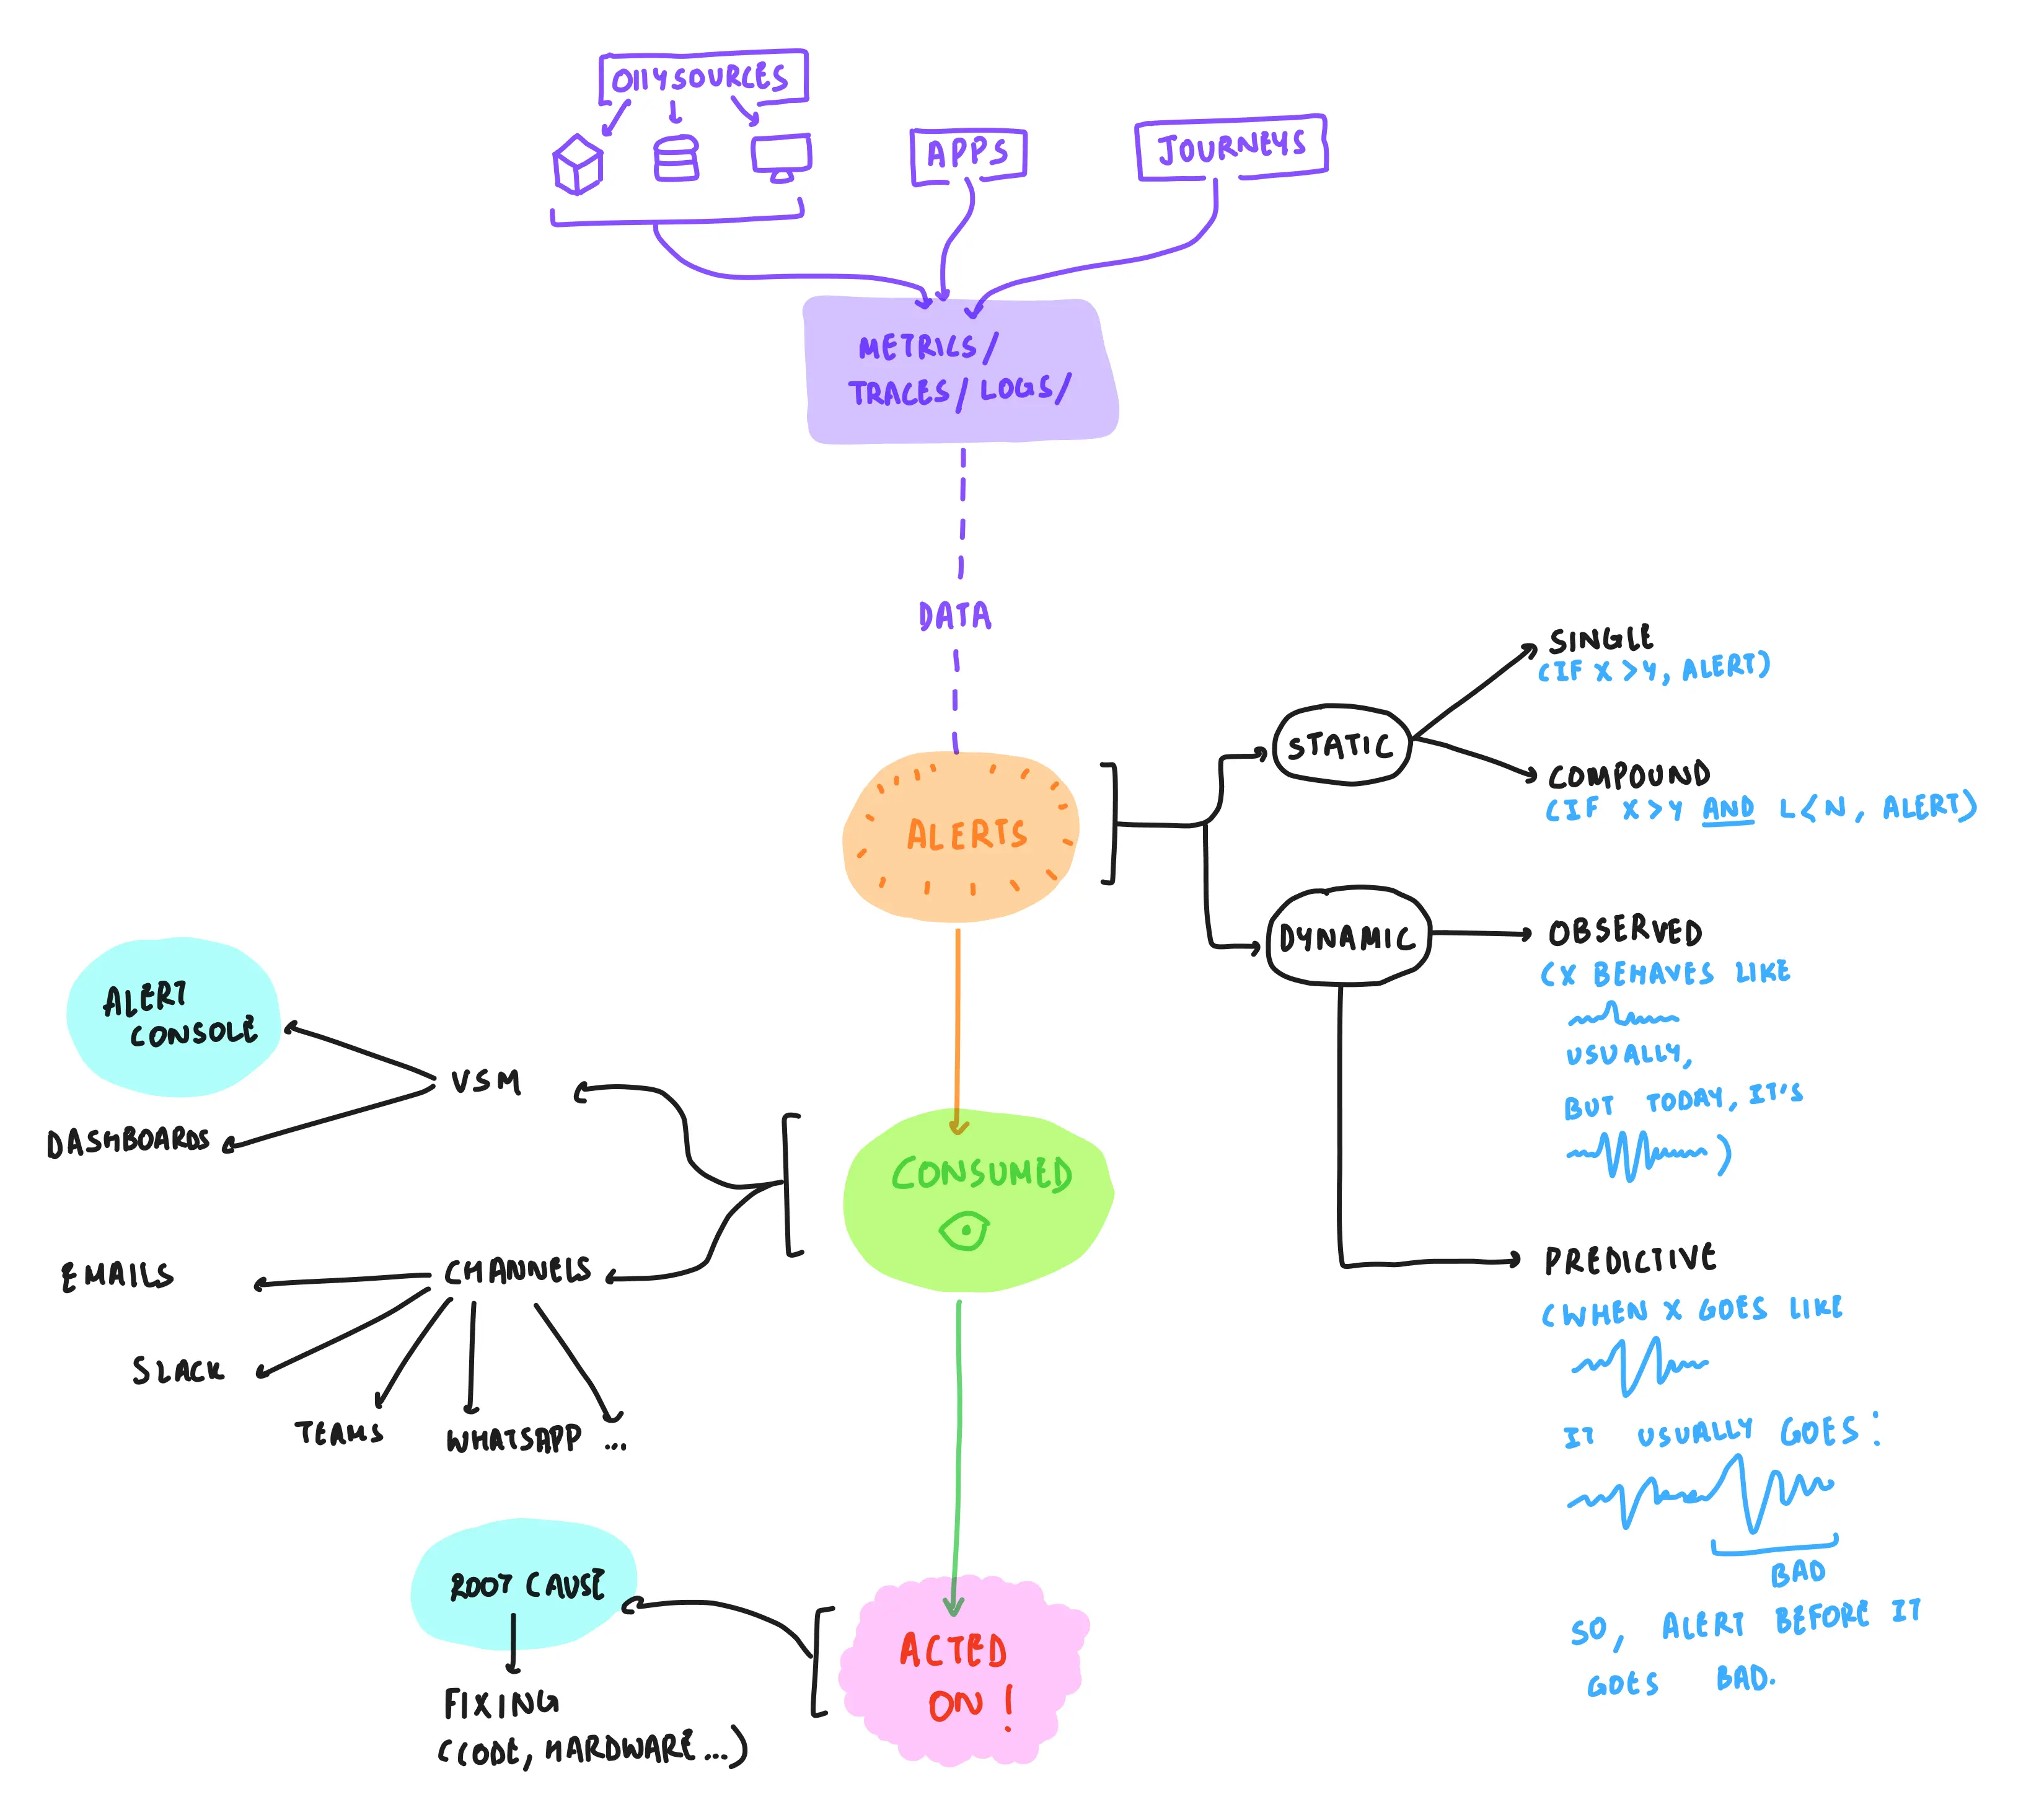
through human-defined or machine-defined rules, vsm generated alerts for the above-mentioned things. when clicked on, an alert was expected to help a person resolve the issue quickly — by enabling faster escalation, helping with root-cause-analyses, and aiding in debugging.
sketched note to understand the system at vunet.
due to the interdependencies in banking-networks, a single active alert (for a few minutes) could result in negative business-impact (and potential fines by authorities).
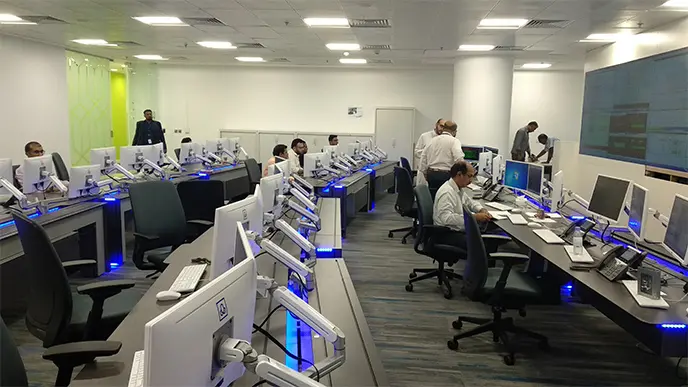
to avoid this, financial institutions hire external teams (such as vunet) to monitor, filter, and escalate alerts quickly to the relevant personnel (who then fix these issues).
monitoring-room (also called the 'itcc-room') in a bank. representative image; source: unknown.
people from these teams were having to deal with multiple alerts in a single minute, manually assessing impact, and jumping through windows (or tabs) to form root-cause-hypotheses. previous design-work had been put in to improve these workflows, but failed to provide a comprehensive solution that was, both, sellable & usable.
i first studied all the different kinds of alerts that vsm could possibly produce, and then proposed a unified system for consumption that aimed to reduce cognitive load.
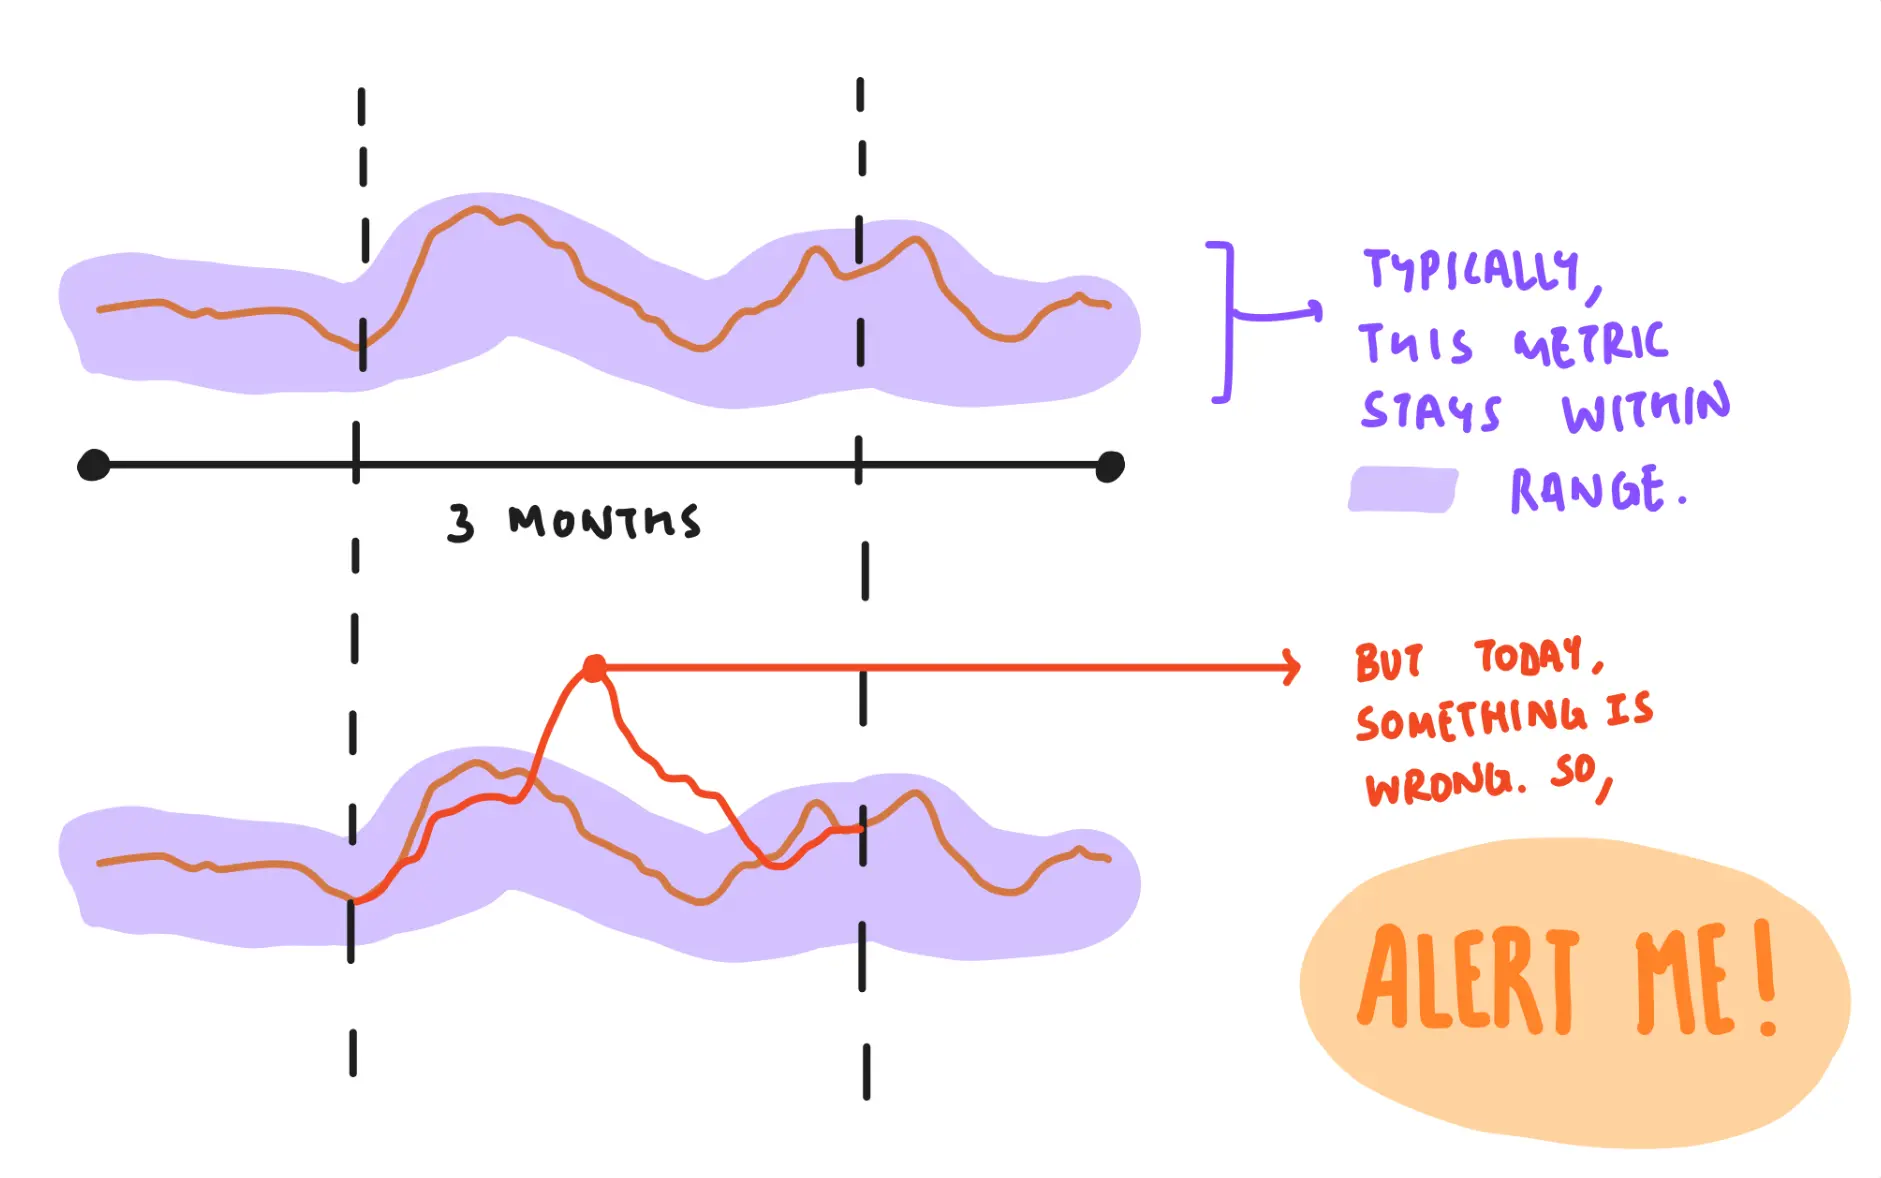
2/4 sketches to understand different kinds of alerts. left: static-thresholding based alerts; right: ml-based anomaly detection.
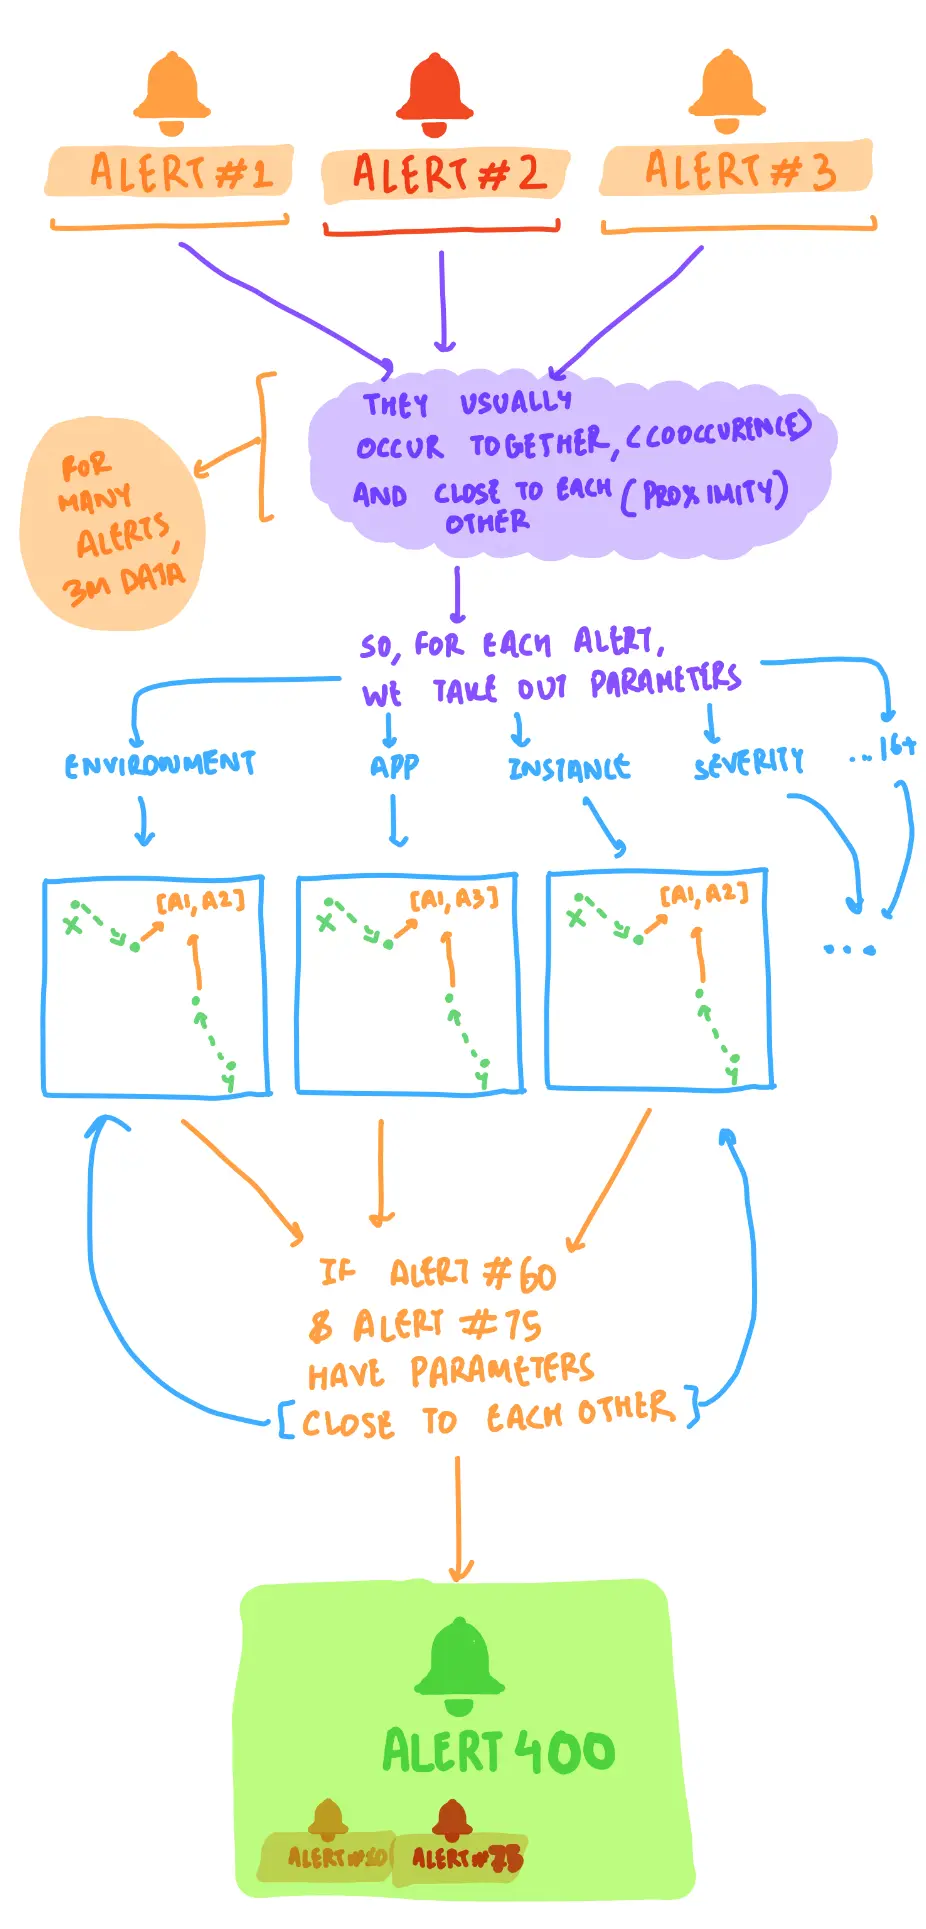
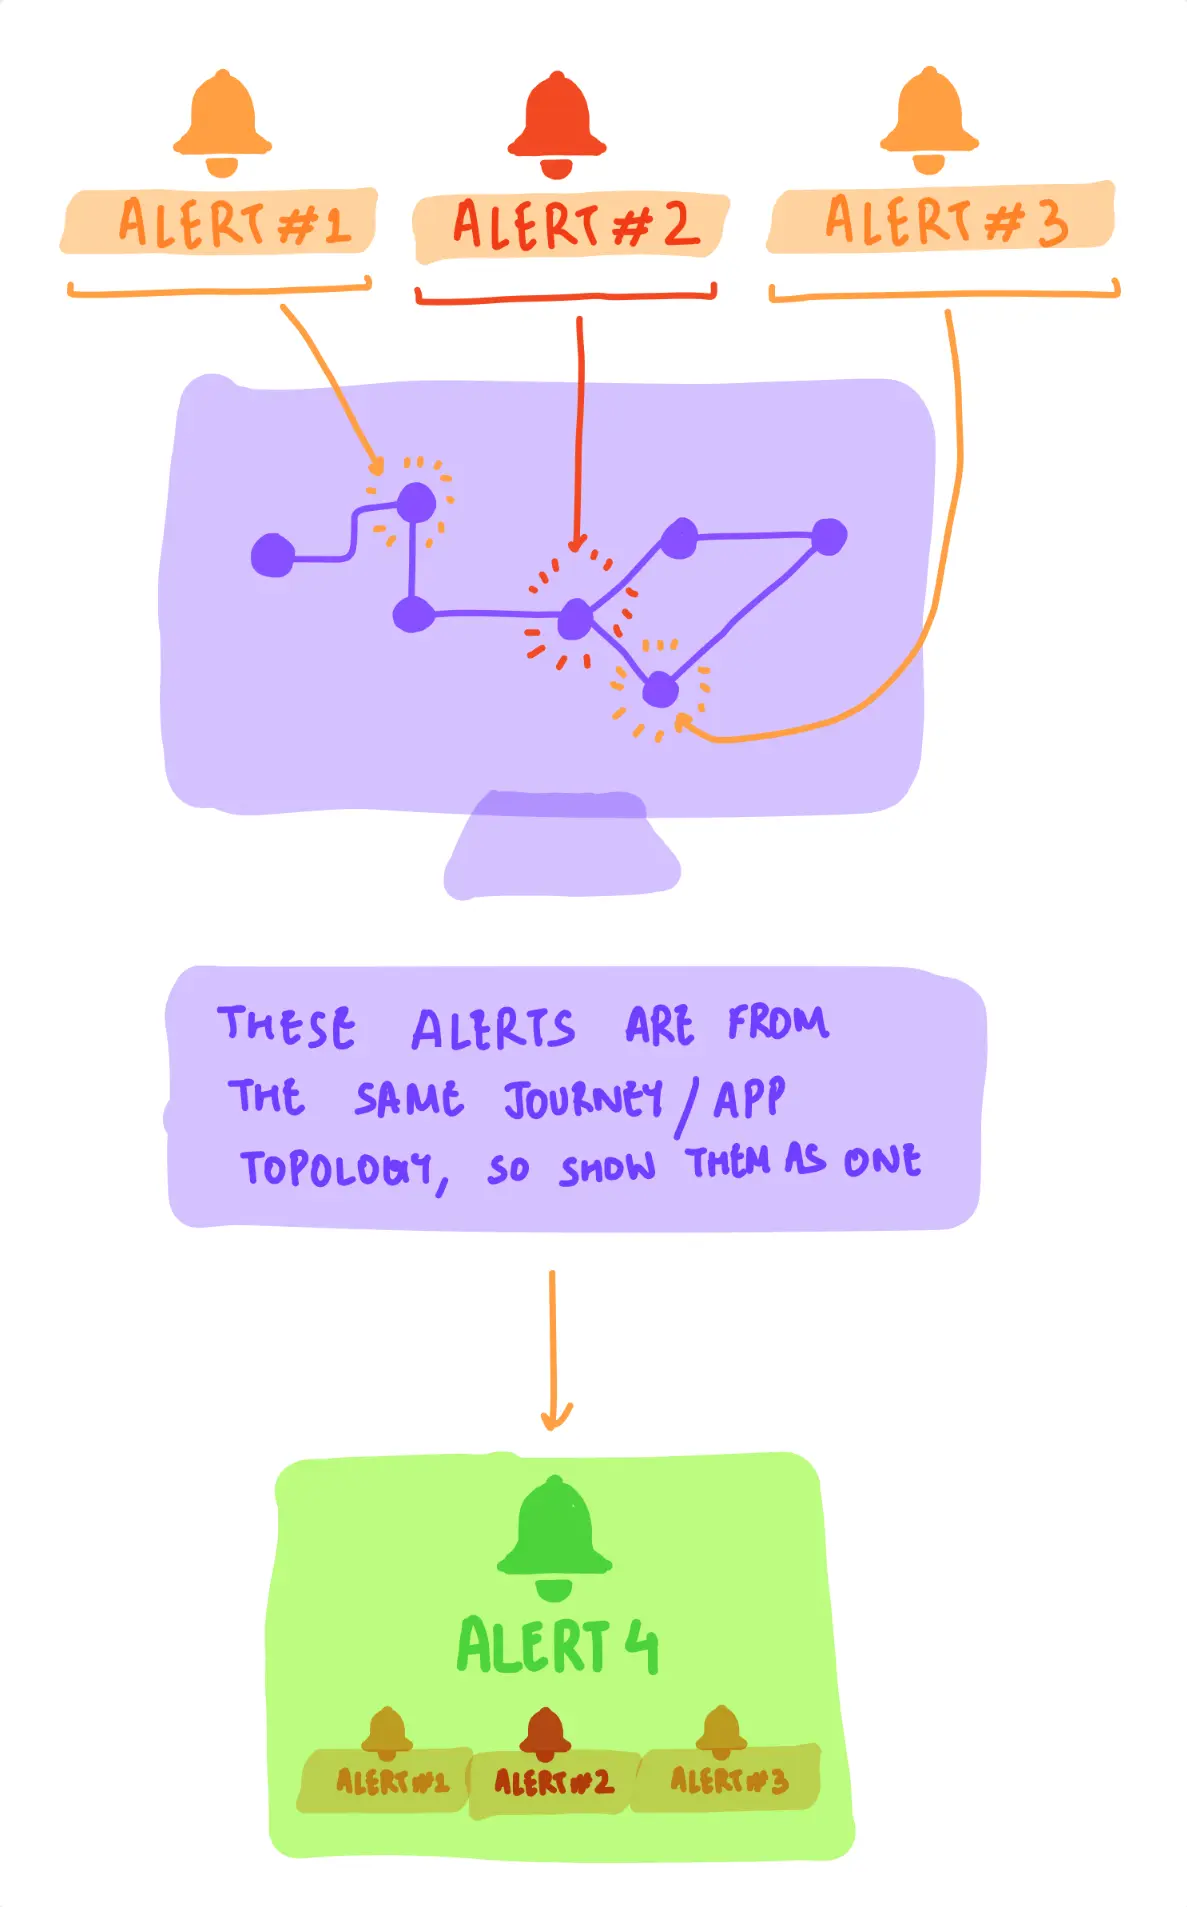
2/5 sketches to understand different algorithms for 'correlating' (or grouping similar alerts together). left: ml-based correlation; right: topology-based correlation.
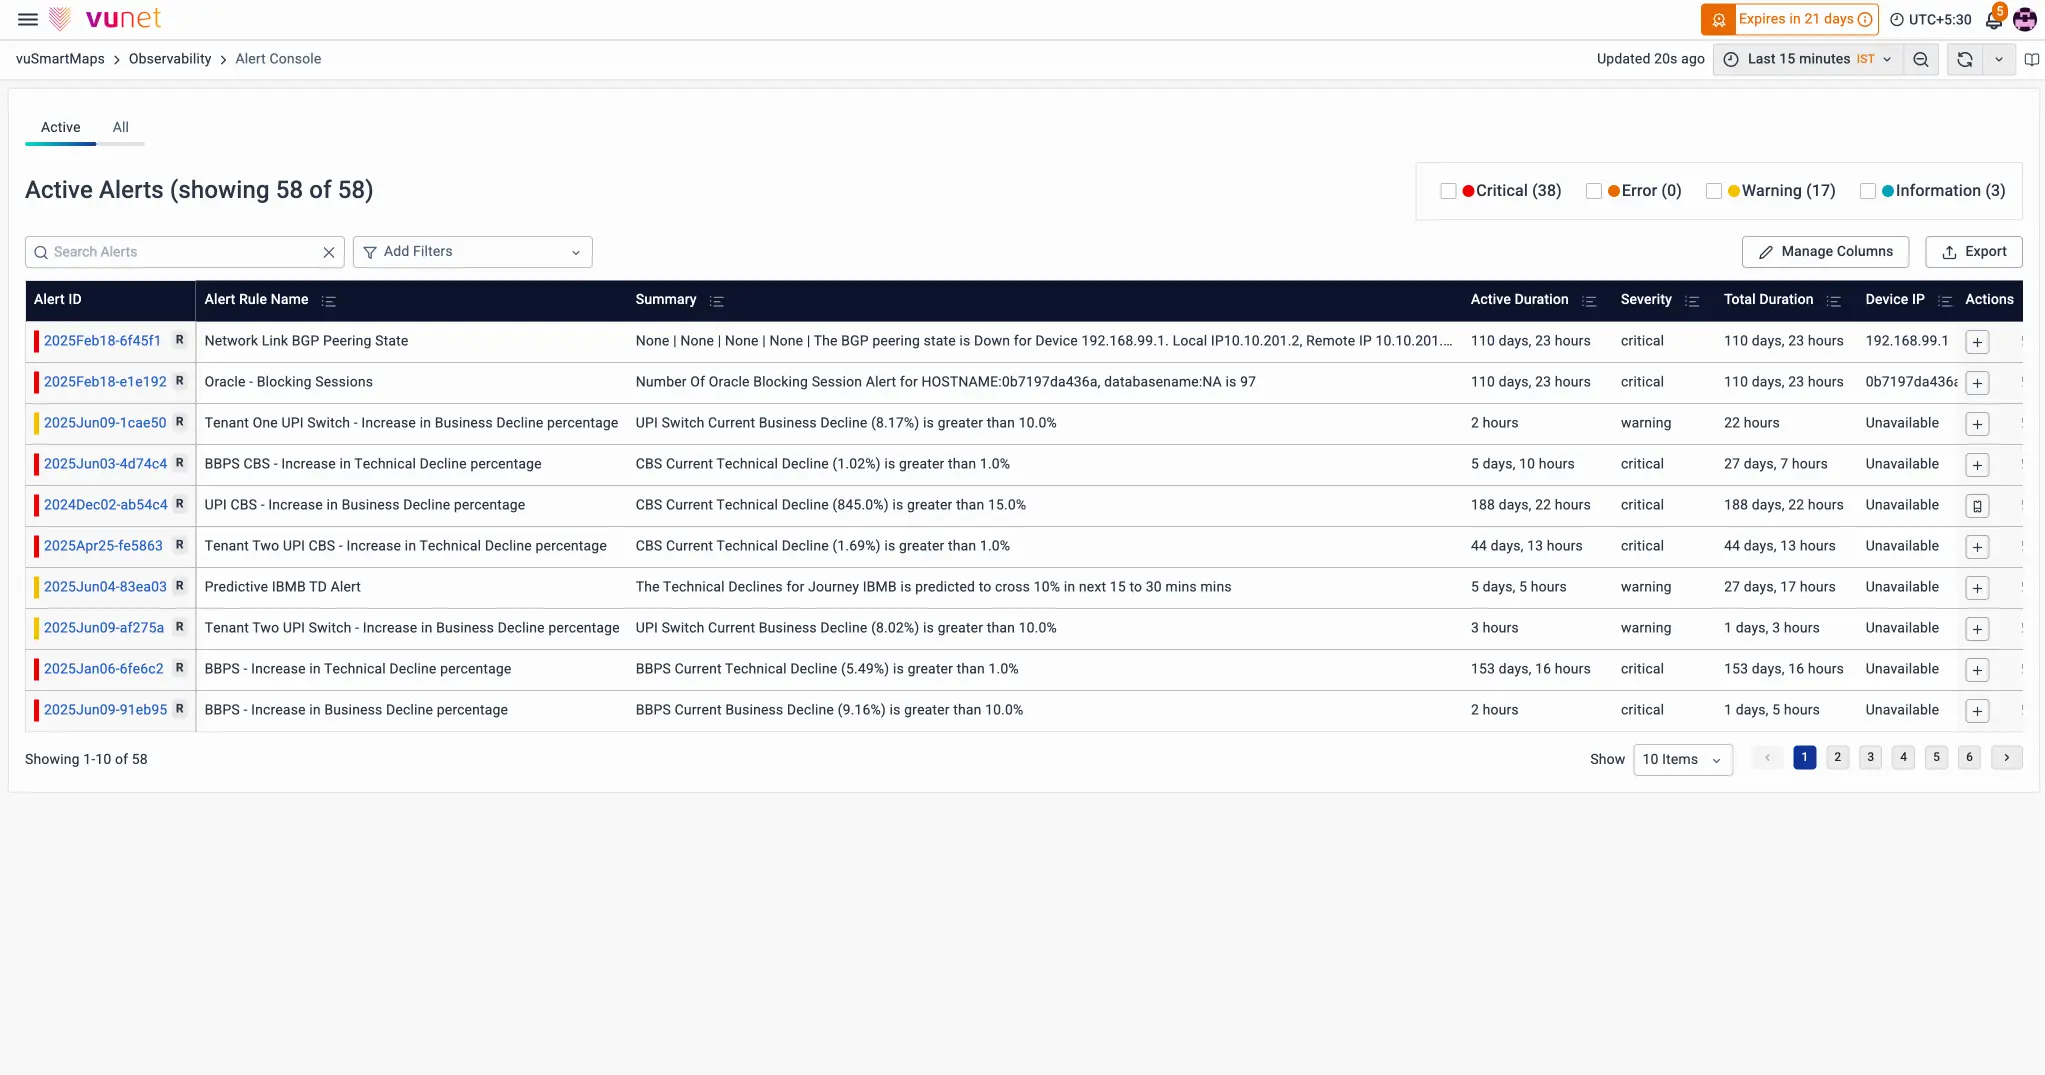
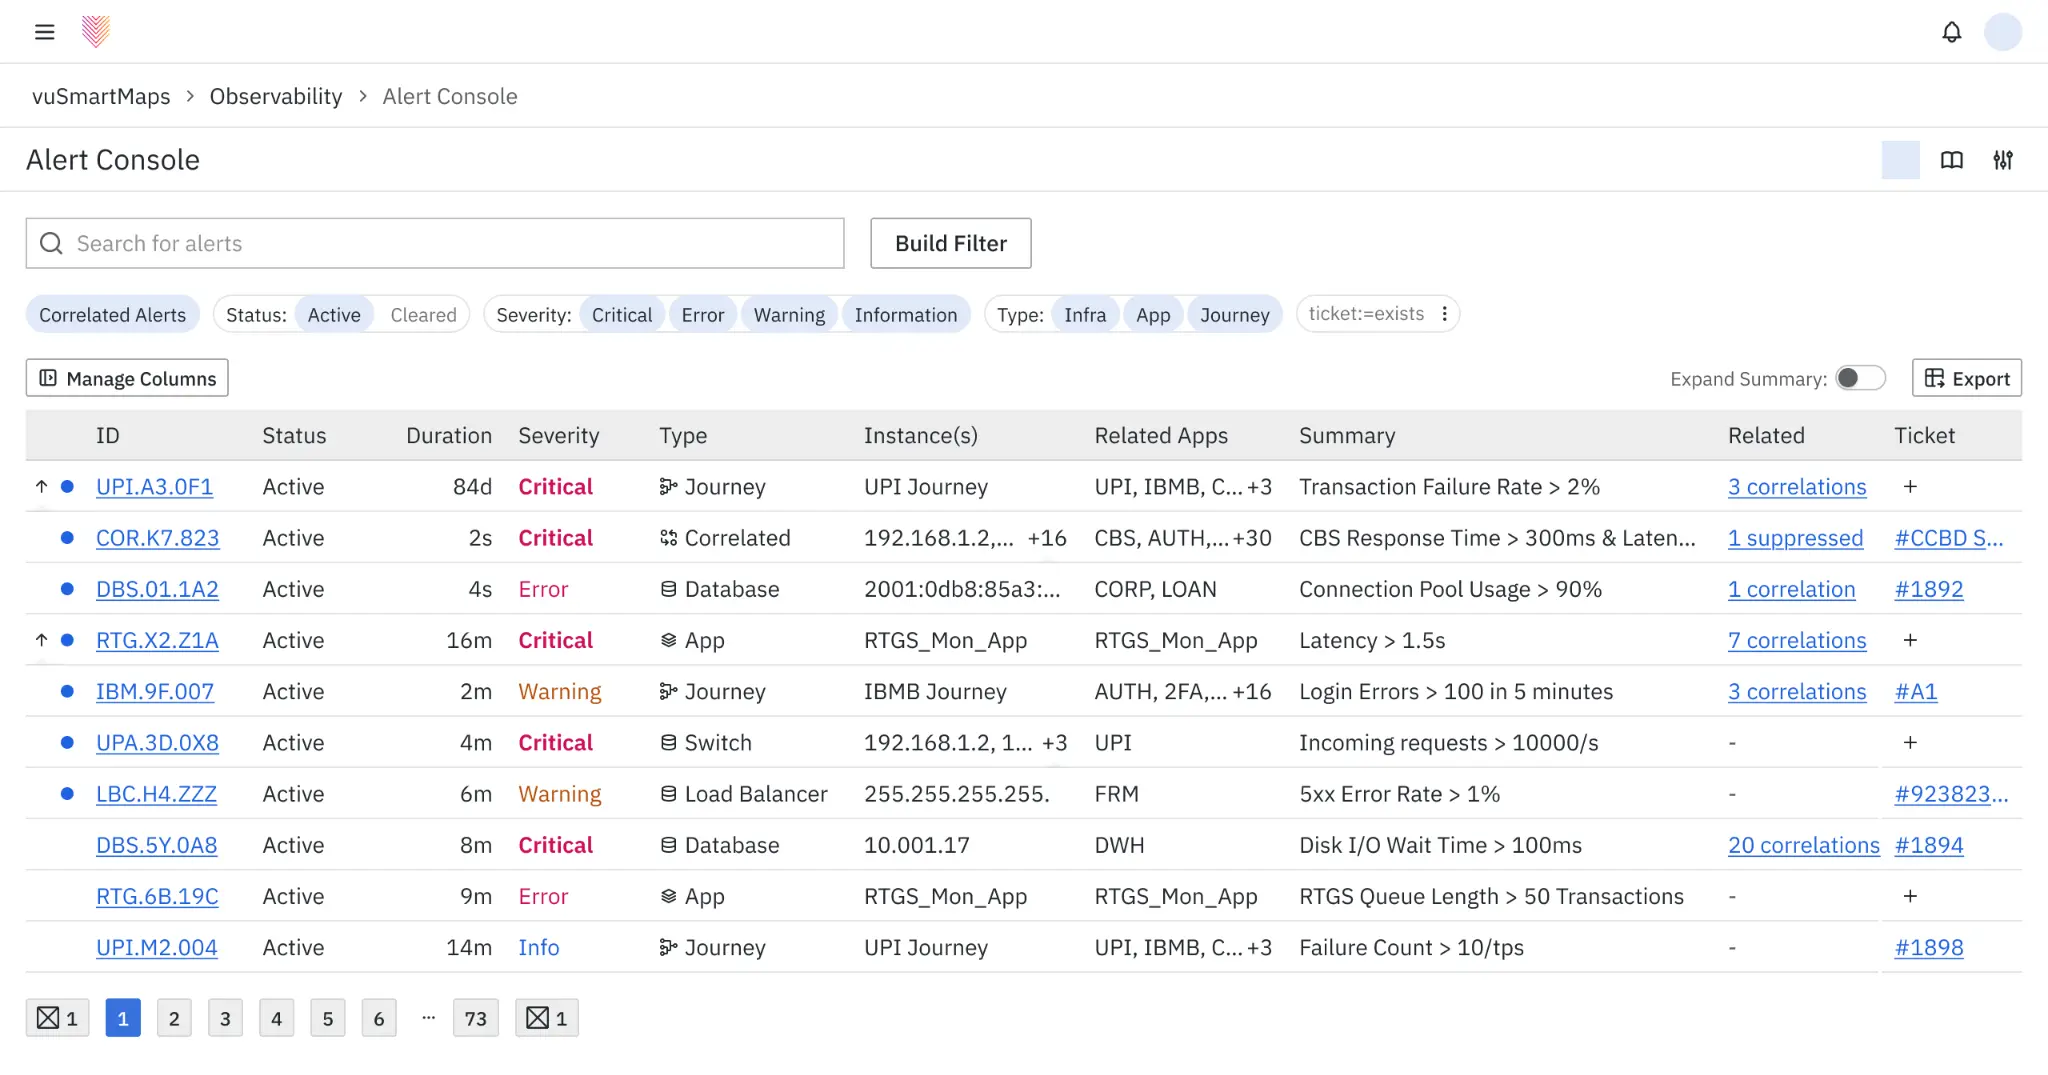
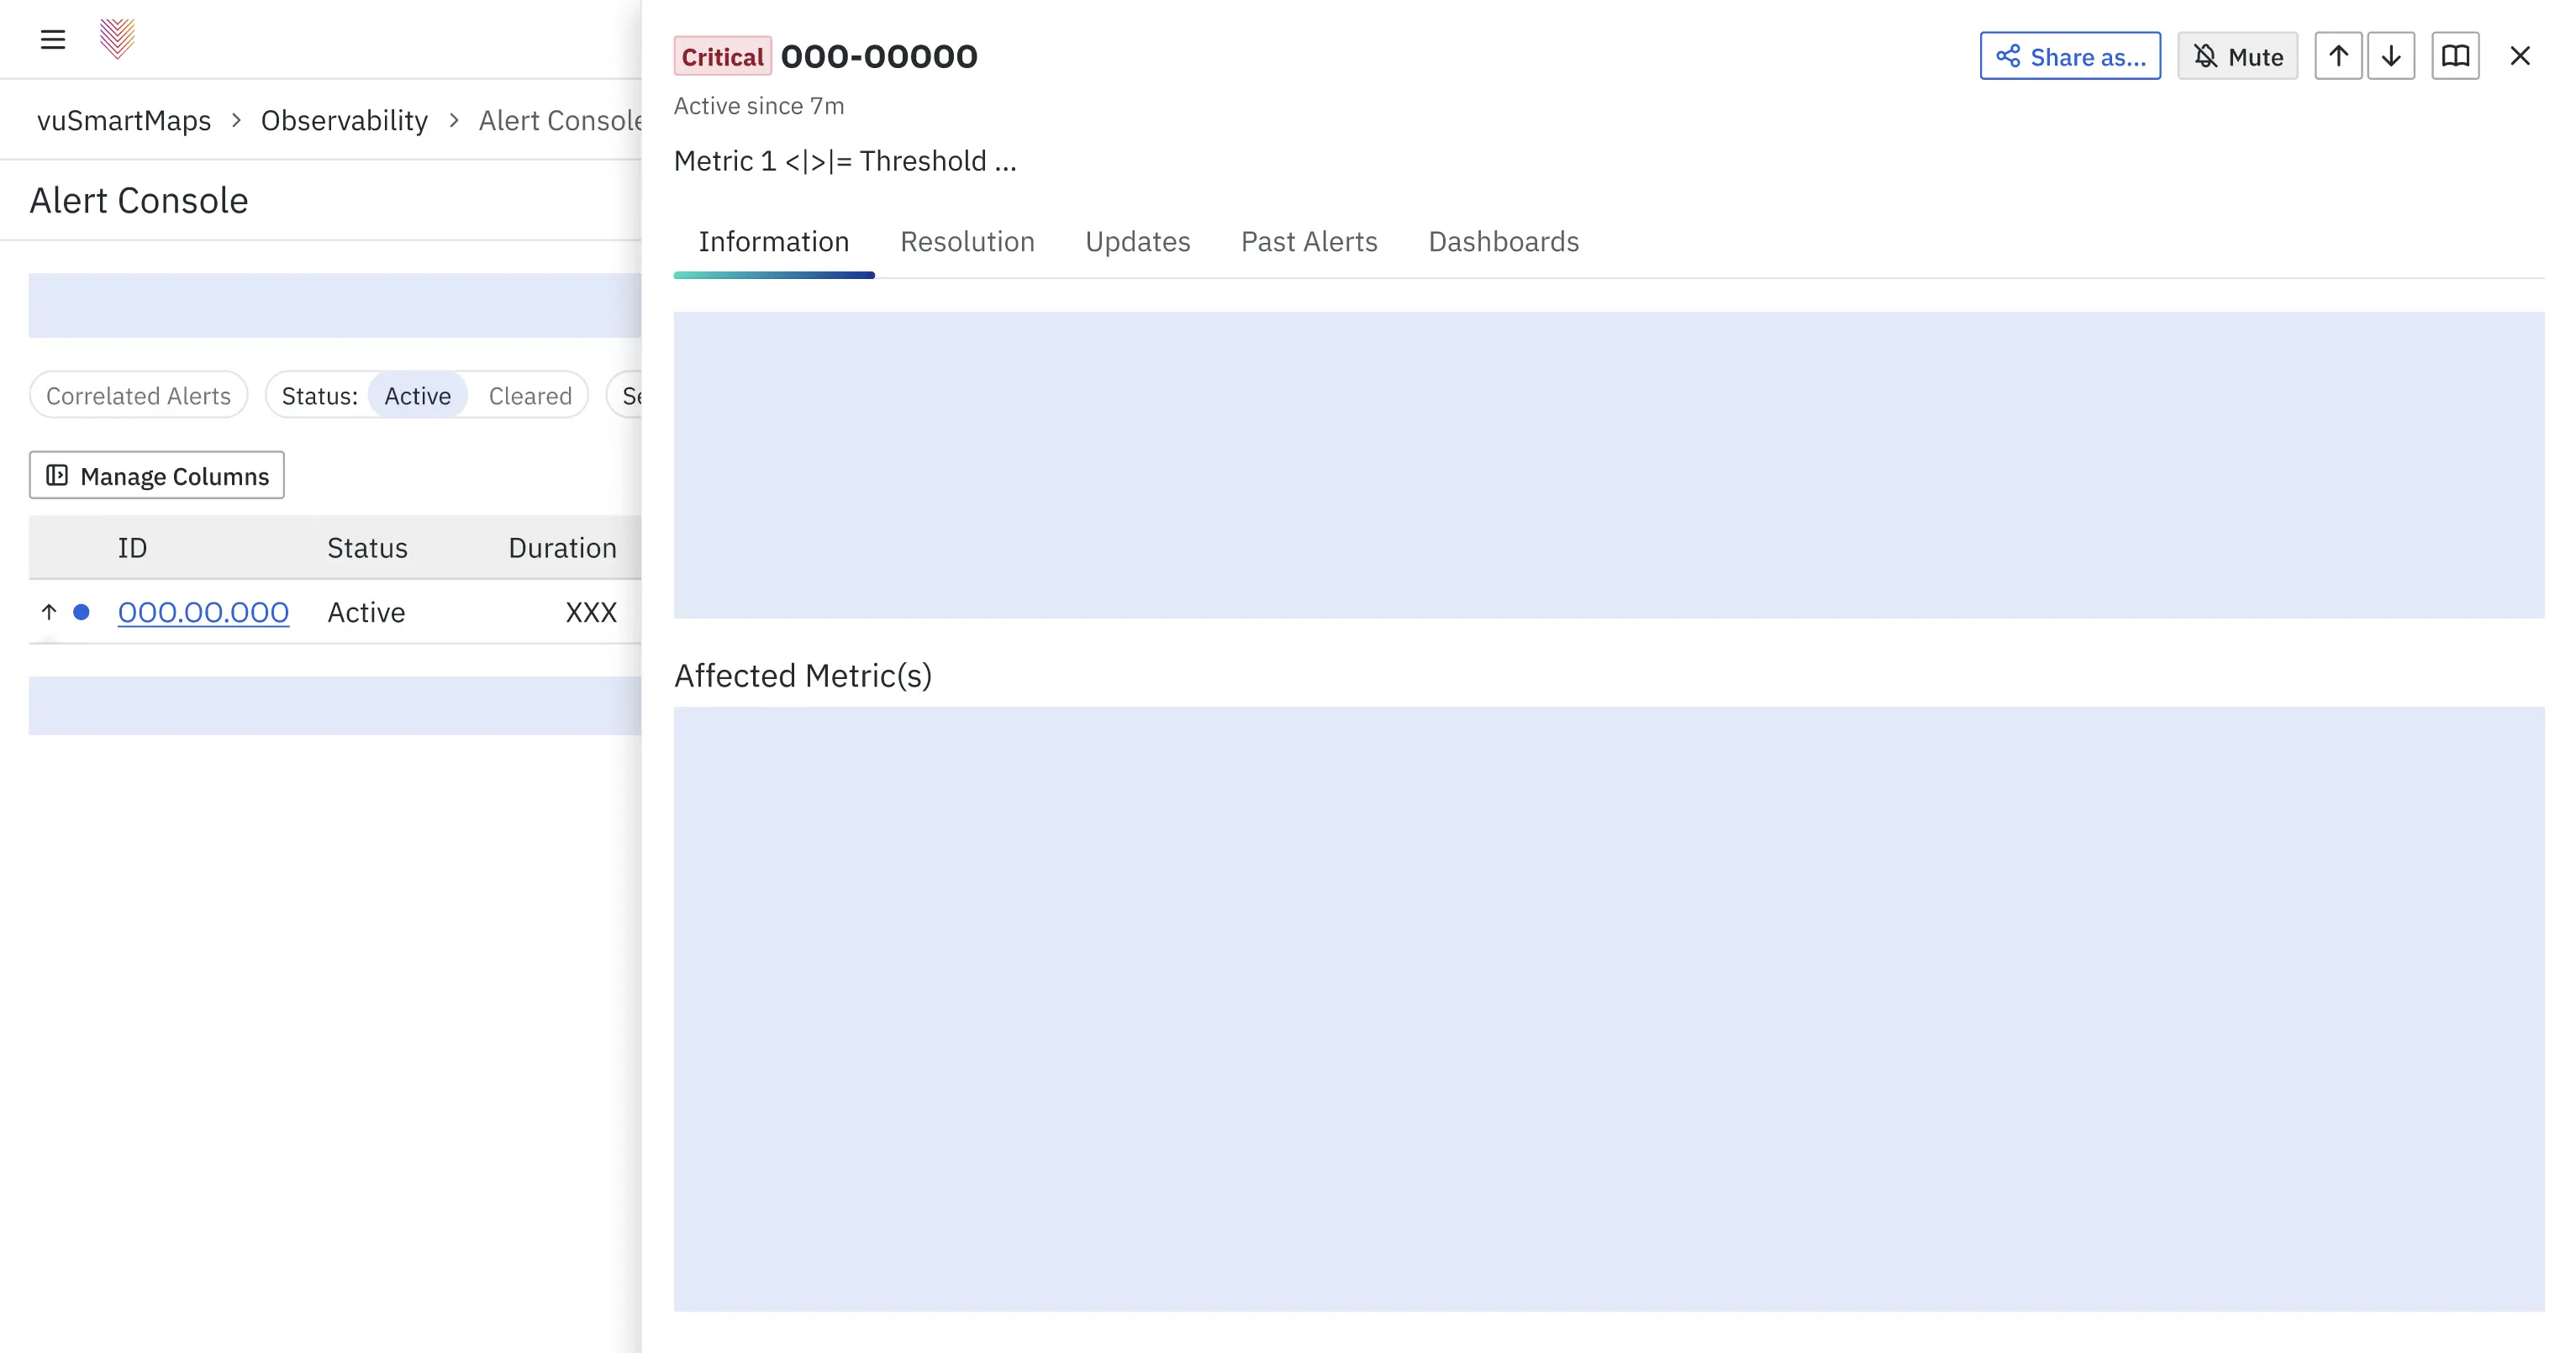
old (left) vs new (right) 'alert-console' — the central point for alert-consumption. interface-design possibilities were restricted by the ui-framework the platform used — grafana. most columns were changed, new systems were proposed (such as a different system for generating unique alert-ids), and indicators clearly differentiated between read & unread alerts (reducing cognitive load).
people could choose to enable a 'correlated-view', where alerts could intelligently be clubbed with each other — requiring a person to look at a single alert instead of, say, 20. since correlations were machine-driven (and prone to errors), we successfully fought against the idea of people only being able to see correlated (or grouped) alerts, as proposed by upper-management.
next, i observed debugging-conversations in banks, and proposed an appropriate system to display an alert's information for all levels of problem escalation (monitoring person, engineer trying to fix it, and managers who wish to perform analyses).
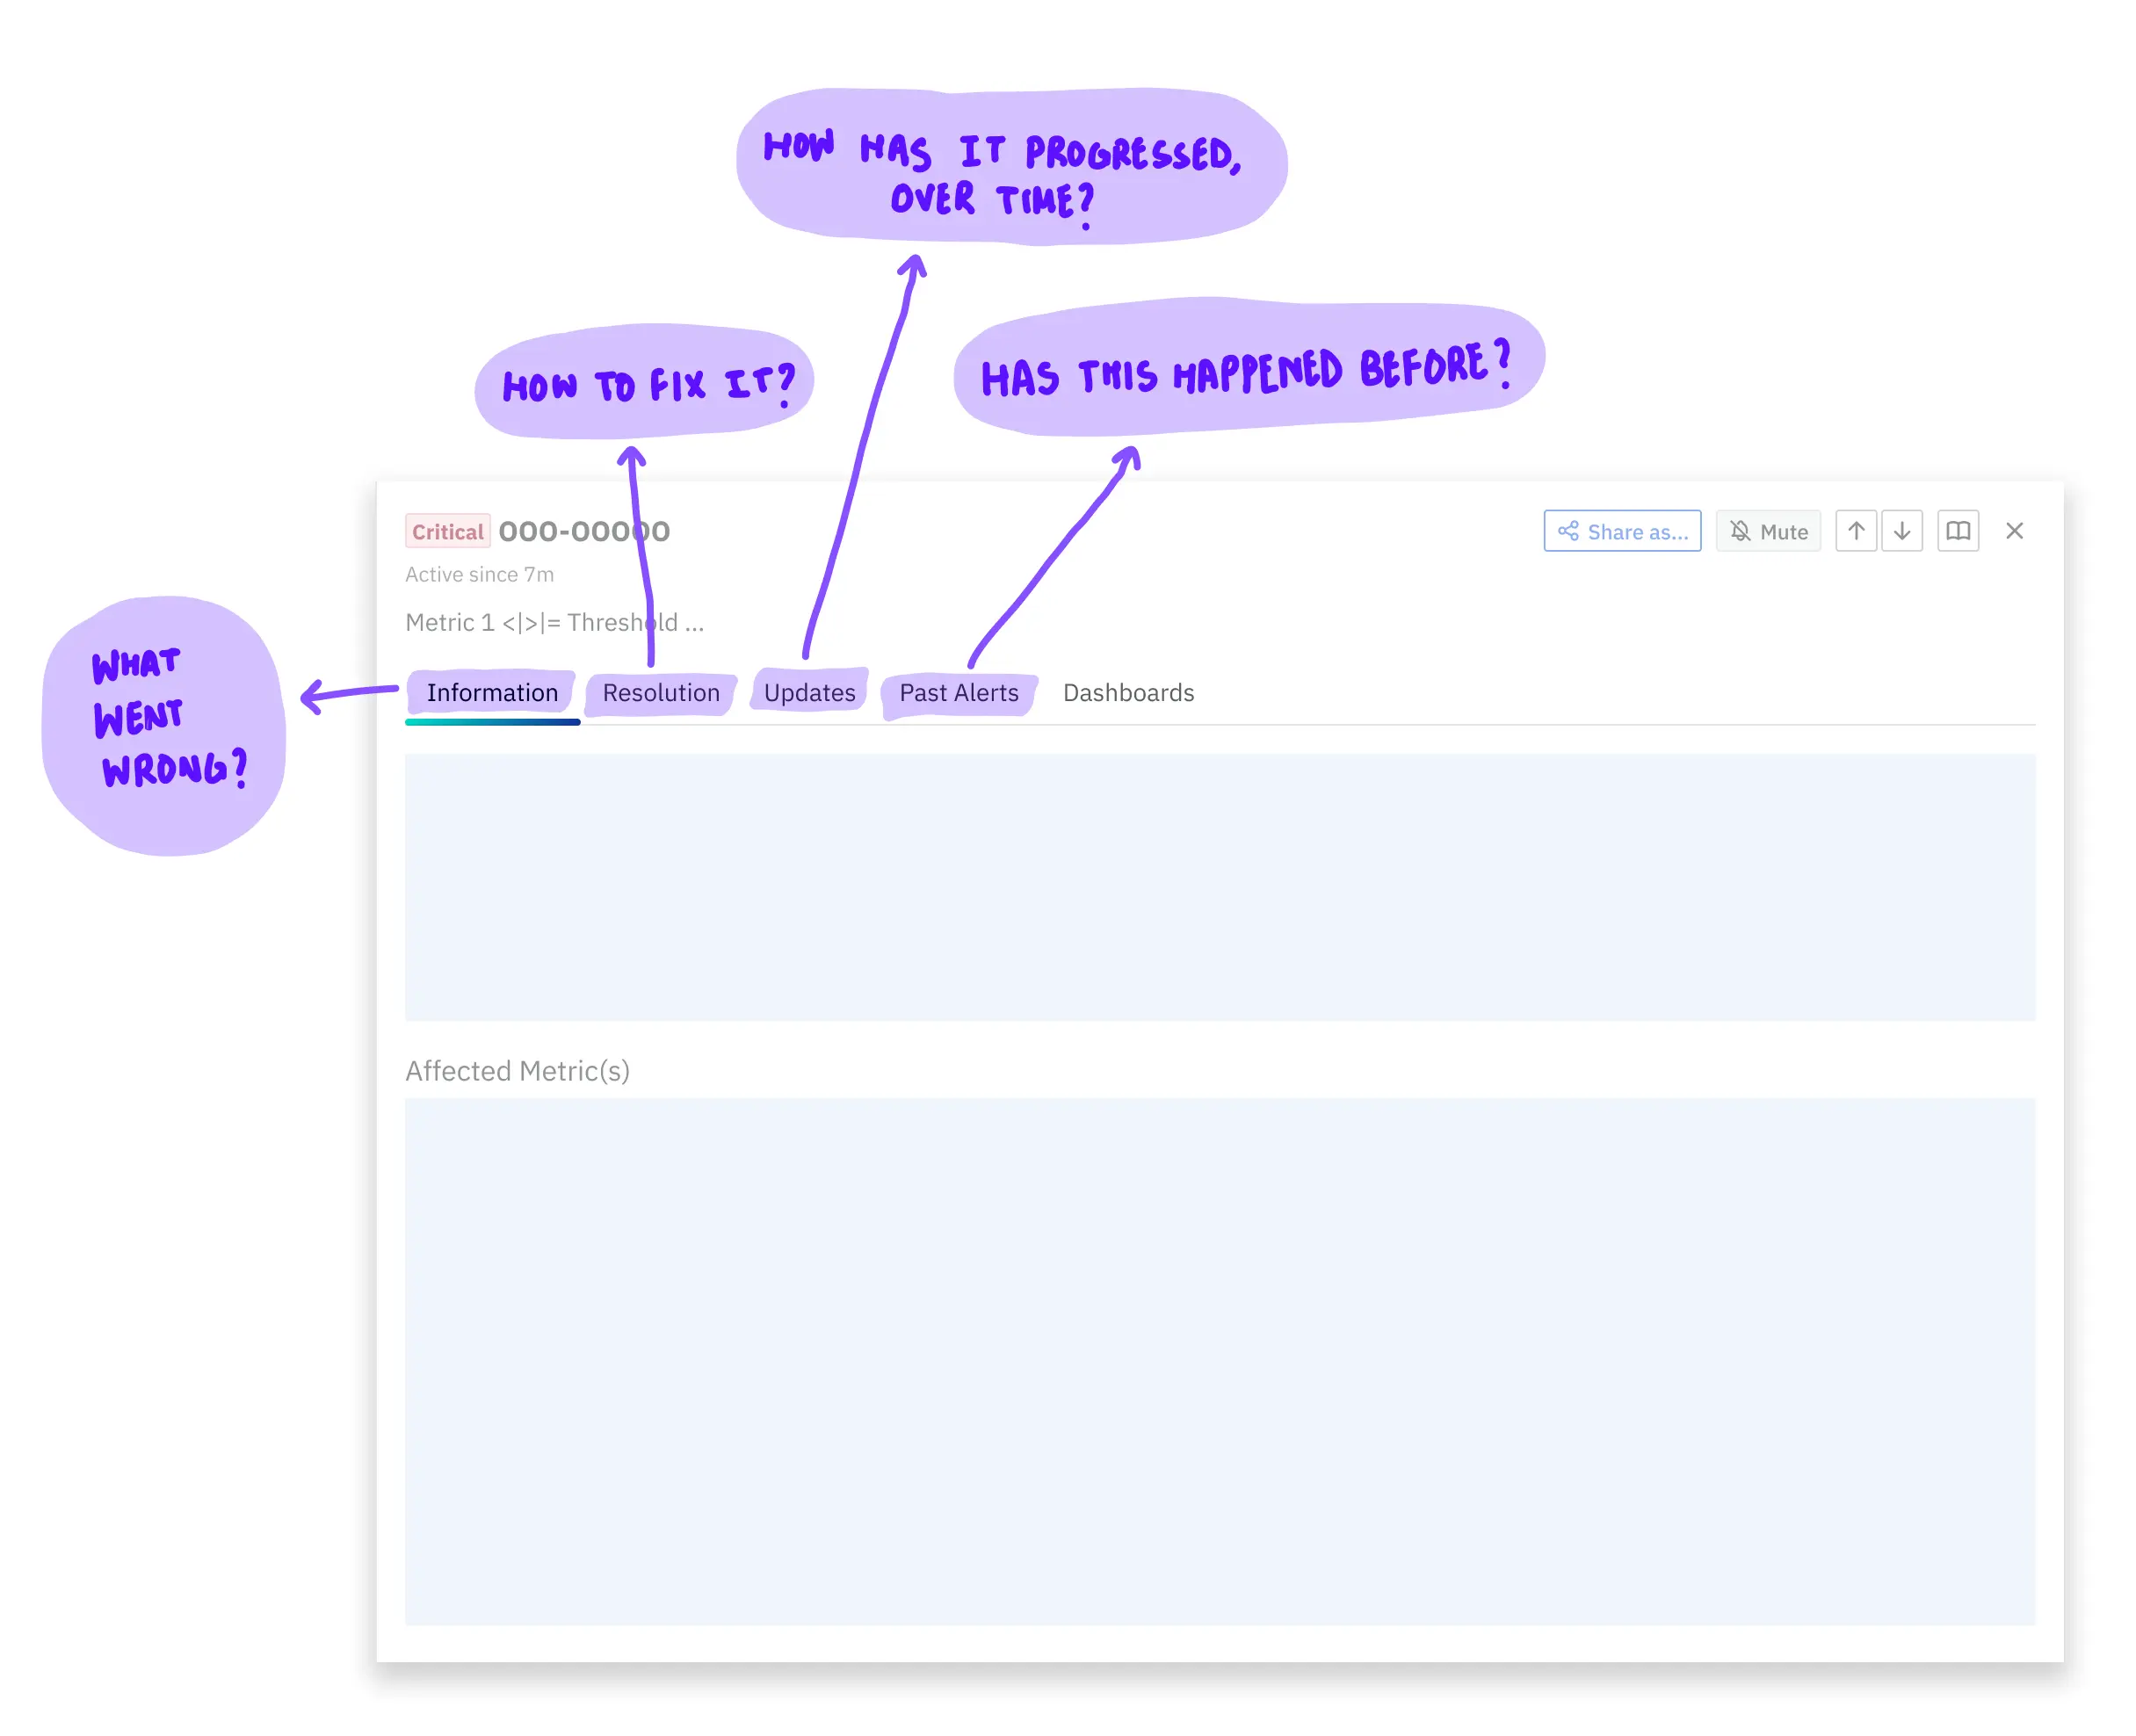
representative wireframe — information about an alert opened in a drawer, so that people who monitor alerts can quickly shuffle between monitoring-view and detailed-view.details were separated into tabs, in such a way that each tab answered a specific question. information that was put into each tab is, unfortunately, proprietary information.
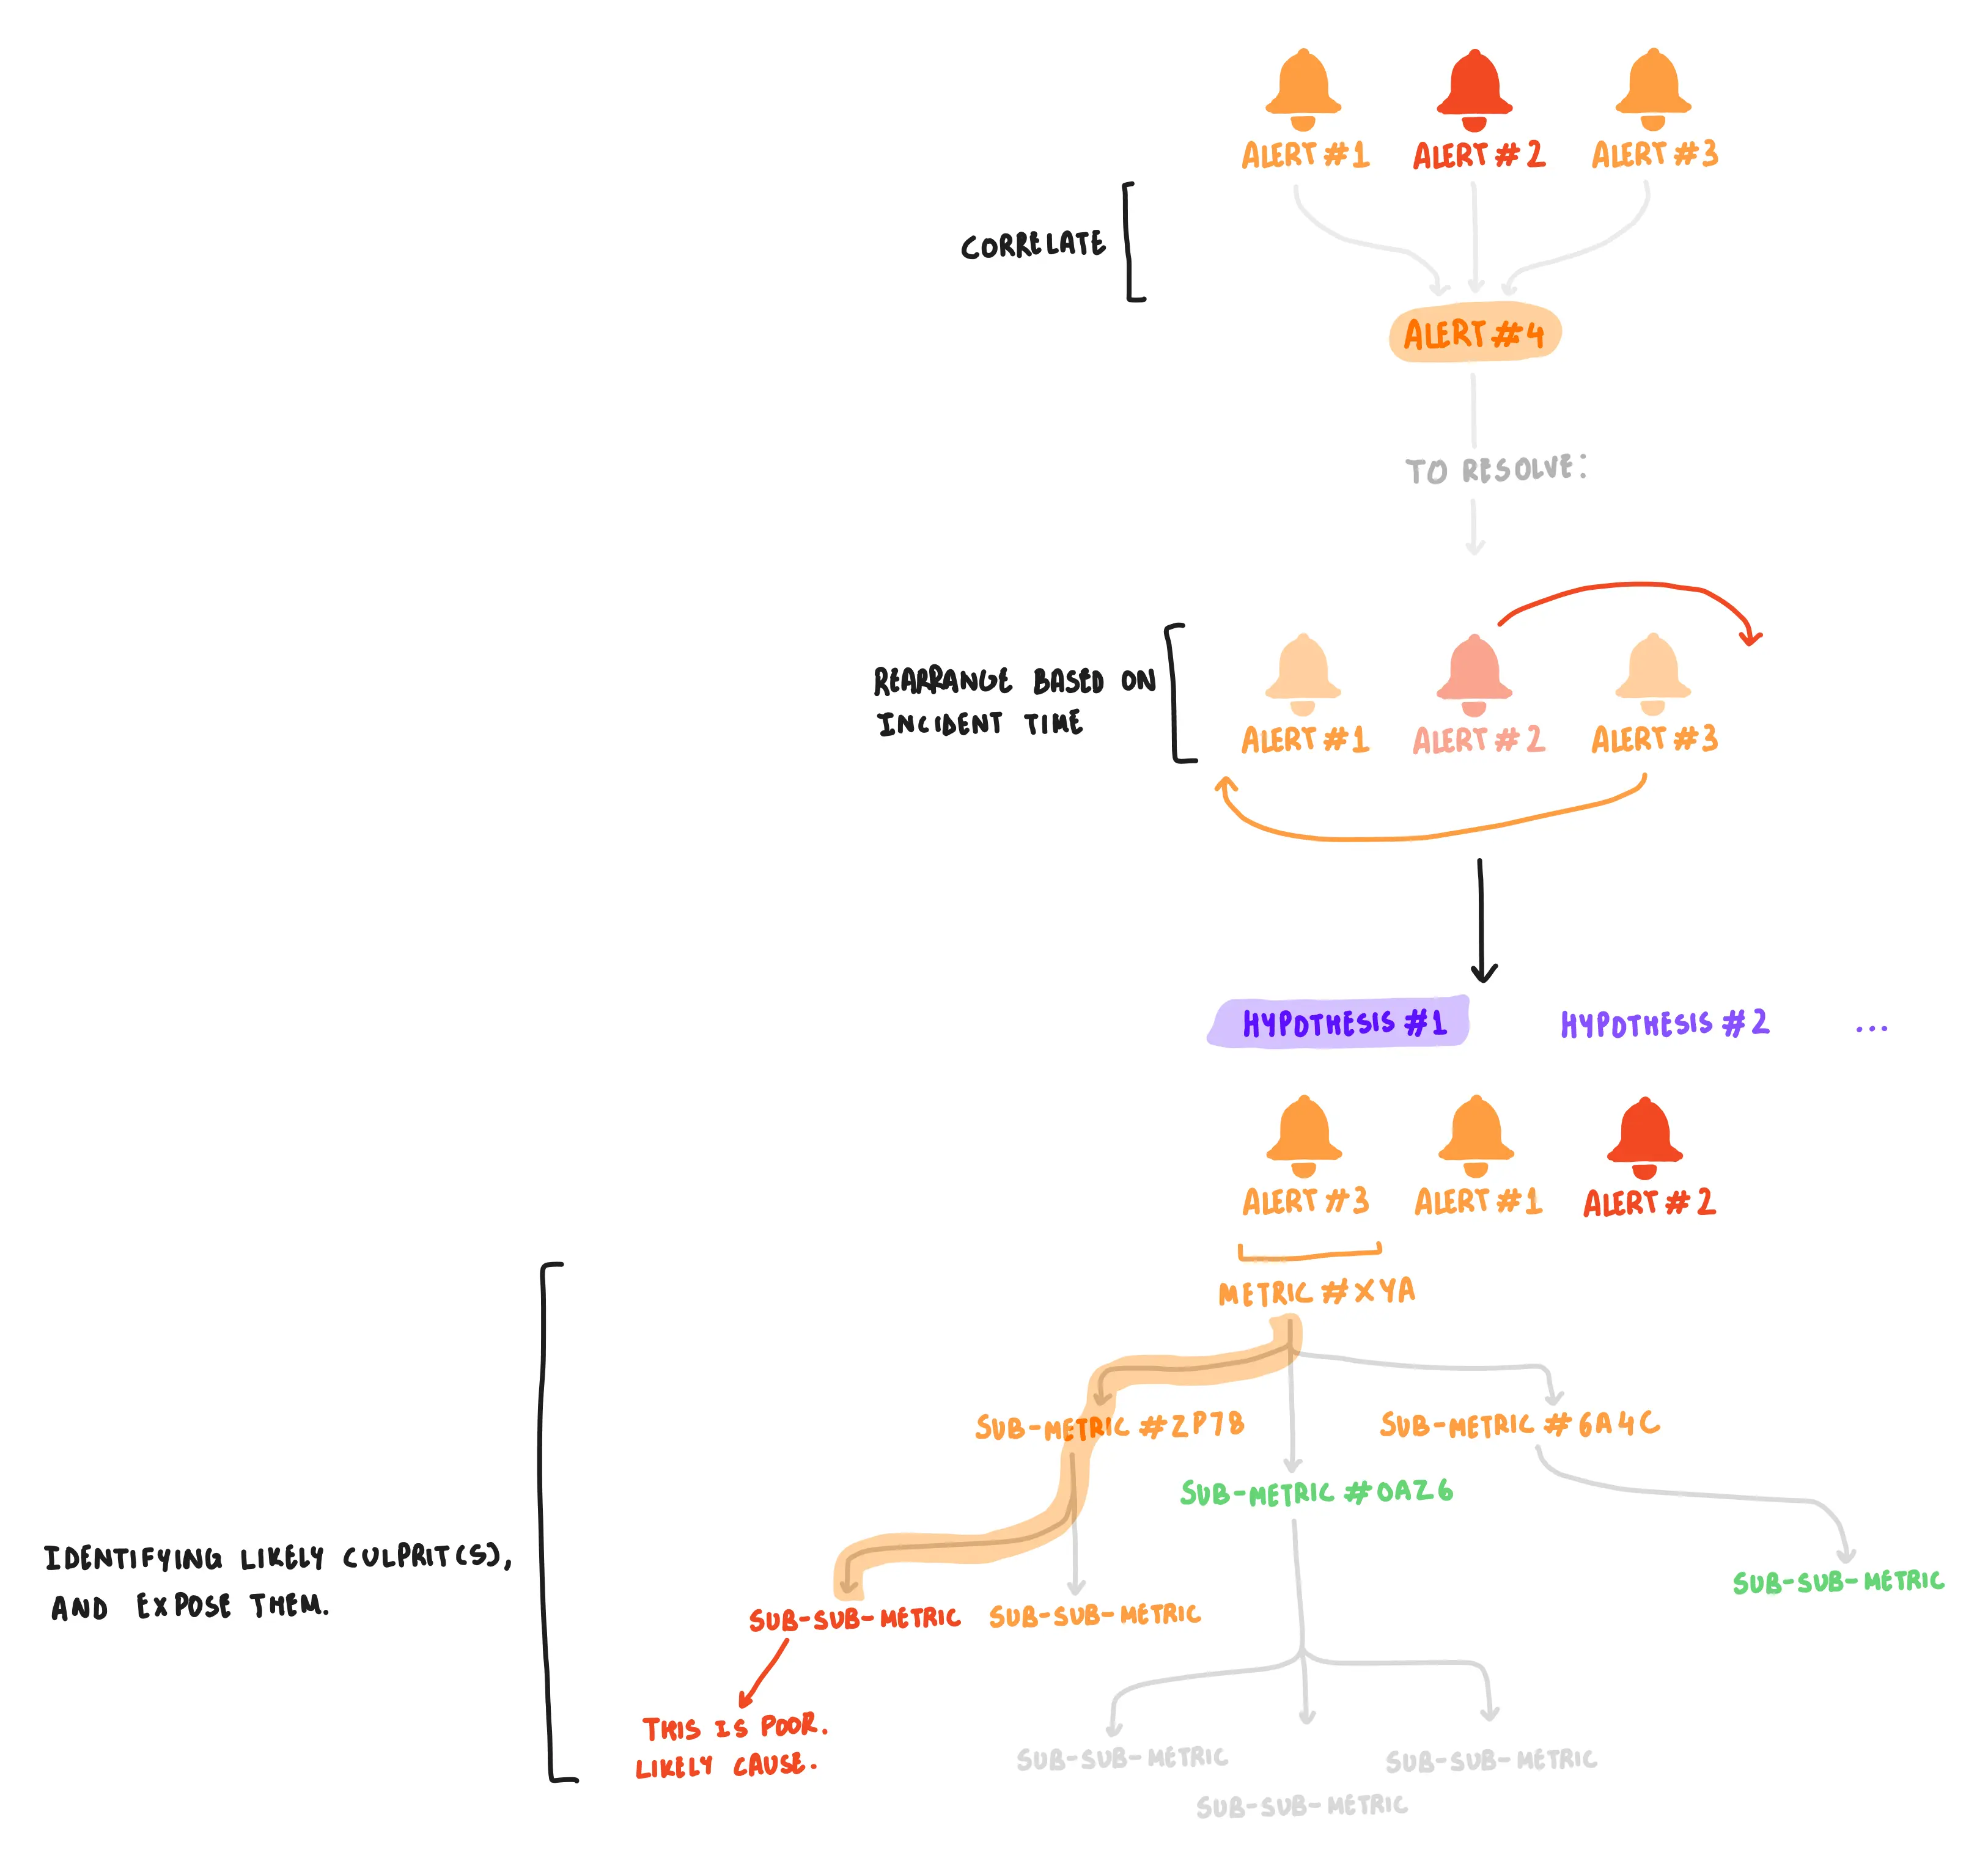
due to the complex computing-architecture that indian banks often have, vsm had struggled in the past to offer accurate root-cause-hypotheses. so, i worked with engineering teams, understanding siloed work that had been put in, and suggested a unified mechanism to display hypotheses. we used correlations (grouping relevant alerts together), time-series data (to identify the first problem in a chain of events), and chose to dynamically fetch poor-performing granular metrics to help with the debugging of a chosen hypothesis.
representative workflow to display root-cause-hypotheses.
via this proposal, the product-design team helped all engineering teams working on alerts to strive towards a common aspiration — reducing the possibility of siloed work happening in the future (that is then difficult to stitch together as a product).
while proposing a better system for consumption, shobhan (co-instigator on this project) & i realised that the system people used to configure alerts opened up many possibilities of creating 'bad' alerts (that are later reported as problems by people who consume them).
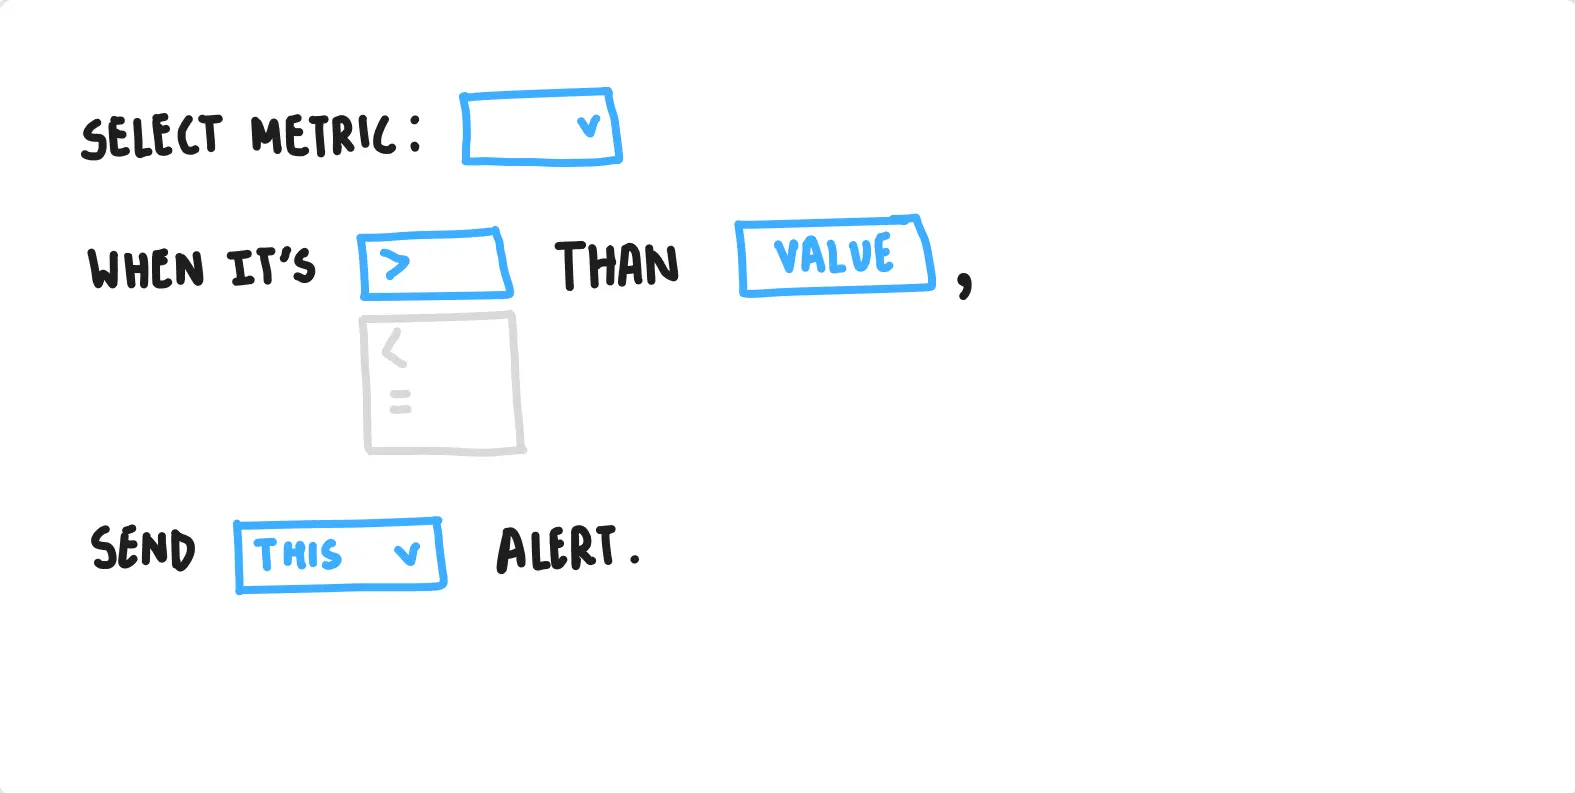
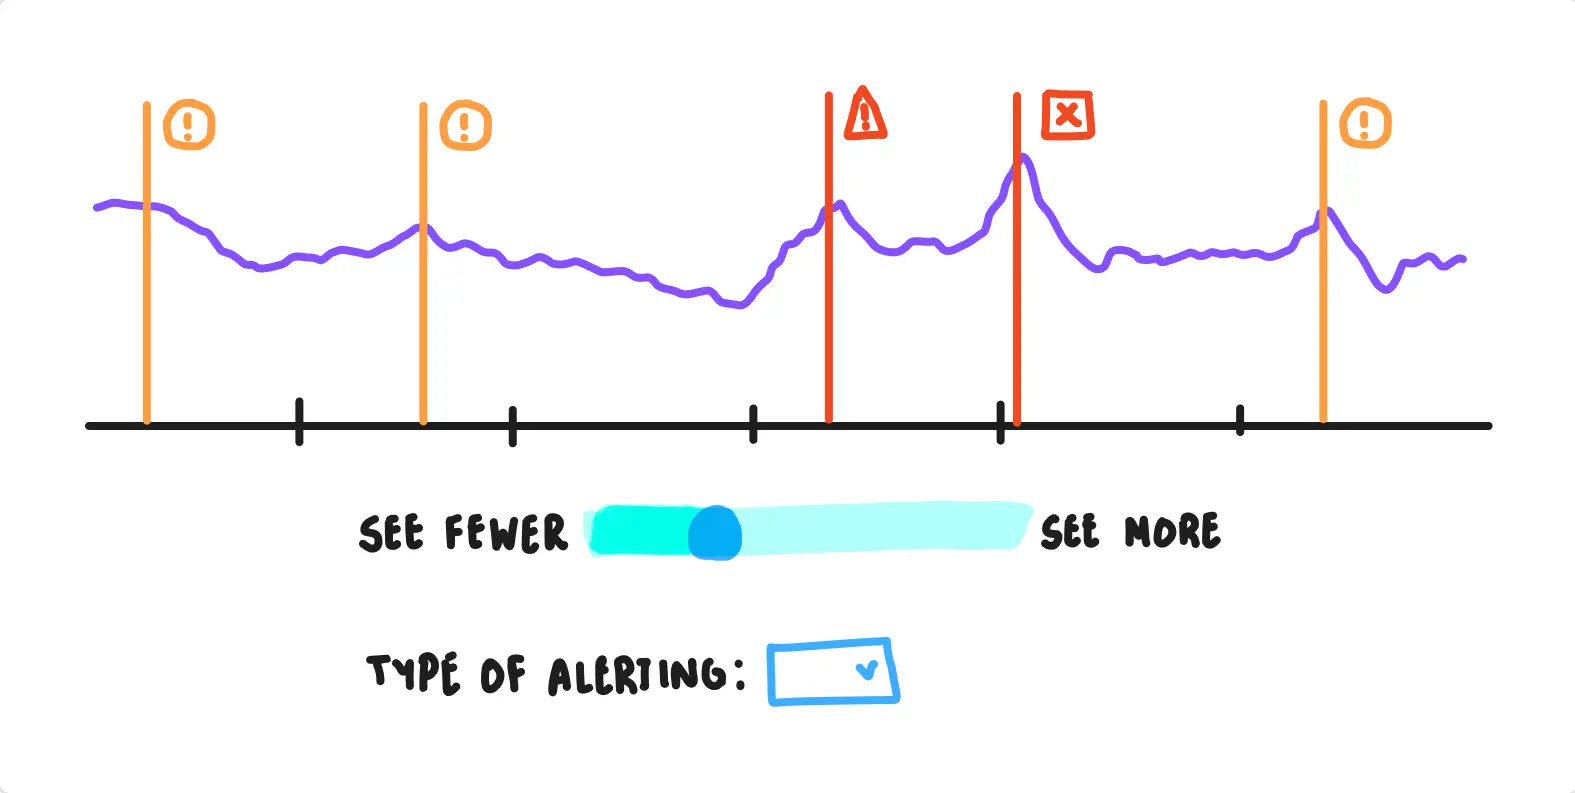
so, we got rid of mechanical norms that the industry used to set up alerts (via numbers & thresholds), and proposed a wysiwyg-editor (what-you-see-is-what-you-get-editor) to help people estimate future-frequency of alerts generated by a particular rule.
representative wireframe — old (left) vs proposed (right) alert-configuration. through the suggested-mechanism, people could see (and tweak) the frequency of alerts triggered by a particular rule (which is all they cared about, when they reported poor alerts).