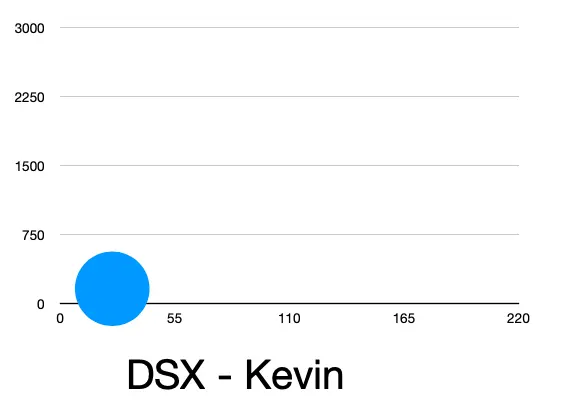
during my first month at tinkerlabs, vaibhavi & abhi were struggling to communicate how instruction from senior-management-members is lost as it is eventually transferred to junior-members at hp, due to the high number of employees. they had the data, but were unable to show the scale.

so, i wrote a piece of software that allowed them to input names of managers and display the dissemination of information to other employees.


